How to Choose a Sightseeing Vehicle in 2026?
Choosing a Sightseeing Vehicle in 2026 requires more than comparing prices and attractive exterior designs. A reliable choice must match the route, passenger demand, climate, and daily operating conditions. A vehicle used on a steep coastal road needs different strengths from one serving a flat museum district.
This guide focuses on practical evidence, including battery range, charging time, turning radius, braking performance, seating comfort, and weather protection. It also considers accessibility, maintenance records, warranty coverage, replacement parts, and operator training. These details often matter more than polished brochures. A short test drive can reveal uncomfortable seats, poor visibility, or noisy suspension that photographs hide.
Real conditions matter.
New technology creates useful possibilities, but it also introduces uncertainty. Electric models may reduce operating noise and local emissions, yet charging access and battery replacement costs deserve careful review. Connected features can assist fleet management, although they should not replace responsible human supervision. Independent inspections, manufacturer documentation, and feedback from current operators provide stronger evidence than promotional claims.
There is no perfect Sightseeing Vehicle for every destination. A compact model may improve maneuverability but limit luggage space. A larger vehicle may carry more guests but struggle in narrow streets. Weather, seasonal crowds, road gradients, and local service availability can change the decision completely. Buyers should question assumptions, compare total ownership costs, and leave room for needs they have overlooked. Careful selection protects passenger comfort, business reliability, and long-term value.
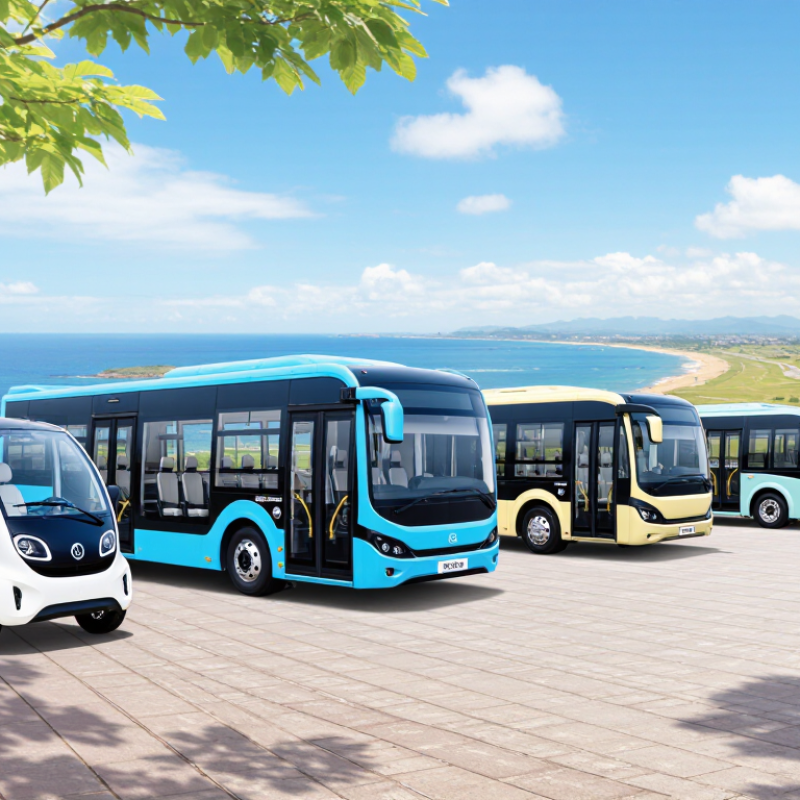
Define the Mission Using ANSI/ITSDF B56.8 Vehicle Classifications
How to Choose a Sightseeing Vehicle in 2026?
Start with the mission, not the paint color. ANSI/ITSDF B56.8 covers personnel and burden carriers, so its classifications help clarify the vehicle’s main duty. A personnel carrier is designed to move passengers comfortably and safely. A burden carrier focuses on cargo, equipment, or supplies. A combination vehicle serves both purposes, but compromises may appear. More seats can reduce cargo space. More payload can reduce passenger comfort.
Walk through the actual route before choosing. Count passengers, luggage, staff, ramps, turning points, and daily operating hours. A vehicle carrying twelve visitors on smooth paths has different needs from one moving tools across uneven service roads. Check the rated capacity, braking system, steering response, guards, visibility, and boarding access. Confirm that the proposed configuration matches the current B56.8 requirements and the manufacturer’s technical documentation.
Do not judge capacity by an attractive brochure number. Ask how the vehicle performs when fully loaded, during repeated stops, or on a slope. Battery range may also change with temperature, hills, and passenger weight. That detail is easy to miss. A quieter vehicle may improve guided tours, while durable flooring helps with wet shoes and dropped equipment. The best classification is the one that reflects the real mission, even when that exposes an inconvenient limitation.